Slideshow in Slate about Information Visualization.

The points in the image below represent every possible nine-letter combination of the DNA letters A, T, C, and G. The arcs represent sequences in the fruit fly, mouse, and human.
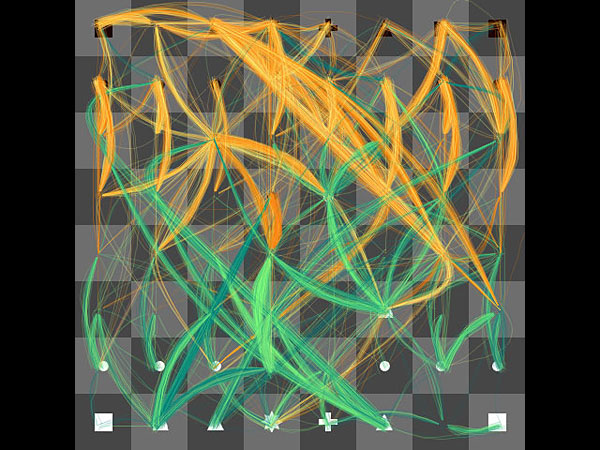
The chessboard represents a chess program actually working out its next move. I tried the original program and it is amazing to view.
And this masterpiece of abstract art represents US population data by county in the years 1790-2000

HT: Andrew
No comments:
Post a Comment